Although the R-squared and MAPE of the final model is good, we still have to check for business sense. In this phase, I visualized the output of the final model in Tableau and check it using my business sense because the mdoel has to align with the real business.
Prepare data for visualization
I created two new files in R using the model outputs. Both of them are used for checking business logic of the model in Tableau.
#contribution
final_model <- lm(Sales ~ black_friday + july4th + CCI + sales_event + comp_media_spend + national_tv2 + paid_search1 + wechat1 + magazine1 + display1 + facebook2, data = mmm_transformed, x = TRUE)
contribution <- model$x %*% diag(model$coefficients)
contribution <- as.data.frame(contribution)
contribution$Period <- MMM$Period
colnames(contribution) <- c(names(model$coefficients), "Period")
contri <- melt(contribution, id.vars = "Period", measure.vars = names(model$coefficients))
write.csv(contri, "contribution.csv", row.names = FALSE)
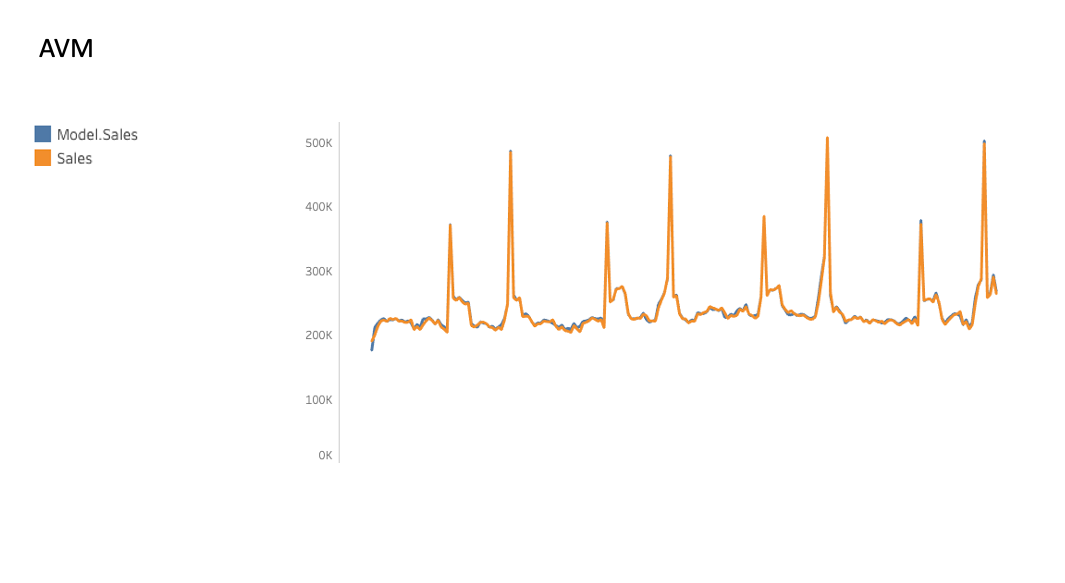
#actual vs model sales
AVM <- cbind(MMM[c("Period", "Sales")], model$fitted.values)
colnames(AVM) <- c("Period", "Sales", "Model Sales")
write.csv(AVM, "AVM.csv", row.names = FALSE)
Visualization in Tableau
I used “activity_and_spend_in_the_past_four_years.csv”, “AVM.csv” and “contribution.csv” in Tableau to visualize the output of my model. The visualization focused on several aspects:
- AVM, which is the grahic showing the comparison of actual sales and model sales.
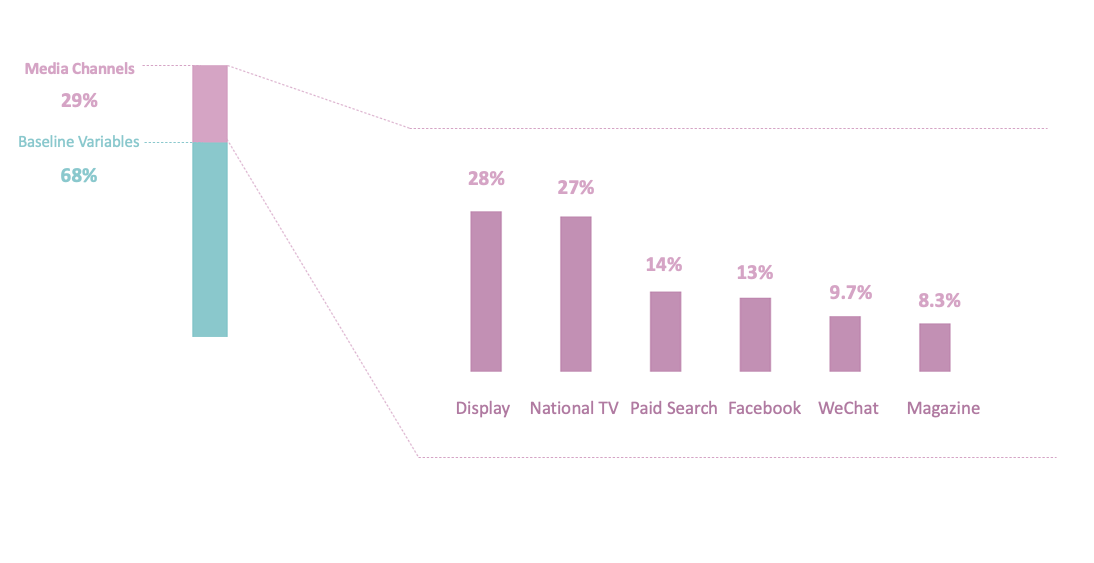
- Decomposition of sales, that is, the contribution of different independent variables to the sales.
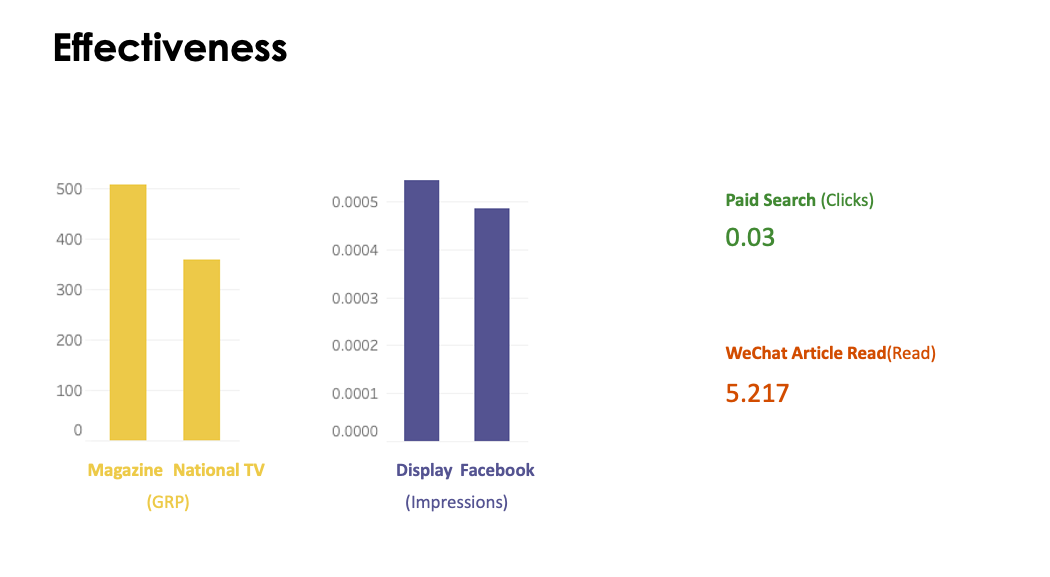
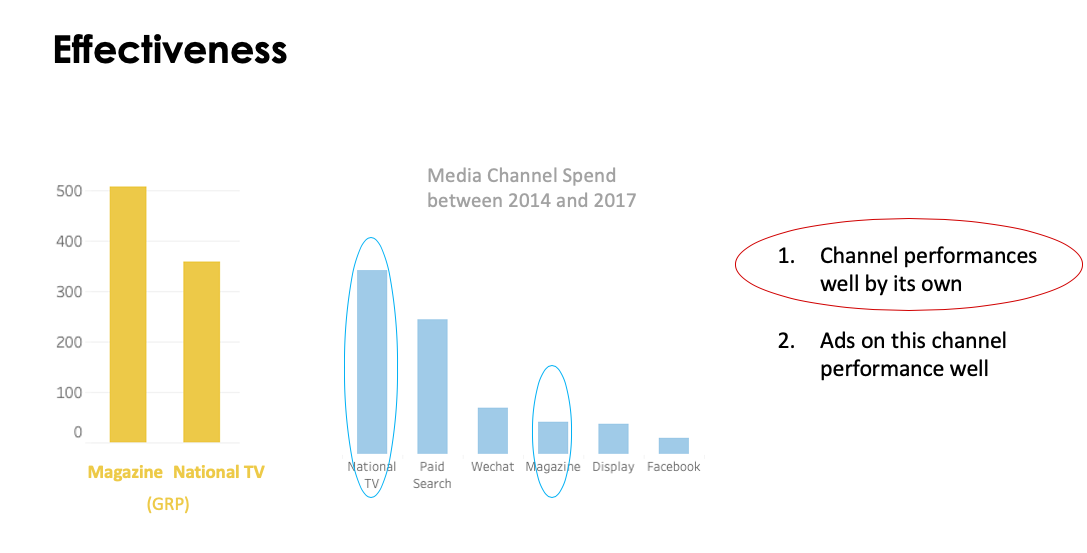
- Effectiveness, which is calculated by dividing contribution of a media variable by its total activities.
- Efficiency, which is calculated by dividing contribution of a media variable by its spend.
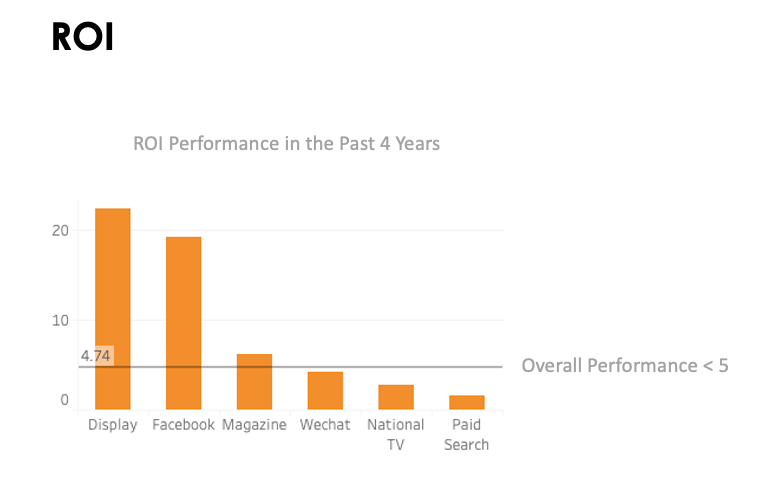
- ROI, which is calculated by dividing a media’s incremental margin dollars (the gross profit) by its spend yields Marketing Return on Investment.
After I modified my model again and again by chaecking for my business sense through the visualization in Tableau, I started to optimized the original spend for the next year that our client gave us in advance (see next post).